International Freight for Heavy Industry
An Industry in Flux—Port Congestion, Geopolitical Stress, Front-Loading, Peaking Volumes and Climbing Rates
An Industry in Flux—Port Congestion, Geopolitical Stress, Front-Loading, Peaking Volumes and Climbing Rates
31 July 2026 | Georg Gleeson
The beginning of 2026 and the forecast for the coming months tell the story of an industry in flux. The supply chain’s new norm is one of uncertainty, where demand is no longer driven by consumer behaviour alone but a slurry of geopolitical events, changes to global economic policy, rising fuel and energy costs, canal restrictions and vessel diversions, amongst other new variables cropping up as we continue to navigate the shifting climate.
Most recently, the expiration of the USA’s temporary 10% global tariff on July 24th proved how much the supply chain is at the whim of global powers. The impending expiration of the temporary tariffs instated early 2026 saw carriers and retailers essentially ‘panic-ship’ goods by what’s known as front-loading (not dissimilar to panic-buying—remember trying to find toilet paper in Covid times?). They did this in a ploy to keep costs down ahead of the (then-uncertain) tariff regime US President Donald Trump announced would follow. A regime we now know covers 99.4% of US imports. The certainty of a lower rate before this change made front-loading even more attractive to those with stakes in shipping, creating incentives for shippers to have already moved cargoes that otherwise would have arrived in August, September and even October.
While this front-loading dynamic will result in a volume decline over the coming months, this phenomenon caused a gradual building in US import volume in the first half of 2026, putting the year on track to overtake 2025’s import volumes. July’s US container import volumes are projected to reach 2.47million TEU, overtaking the previous all-time high recorded in May 2022 when the economy rebounded post-COVID. These policy-driven volume swings cause sharp peaks and valleys in import volume, complicating planning and making demand forecasting more difficult as capacity becomes misaligned with demand.
This is particularly evident for trans-Pacific trade, with the Port of Los Angeles recording that it handled over 1 million TEUs in June, the port’s busiest June on record and only the third time it has recorded volumes over 1million TEUs. The neighbouring Port of Long Beach also faced record surges in June. During his monthly Supply Chain Insight briefing, Port of Long Beach CEO, Dr Noel Hacegaba, echoed that “businesses are preparing for volatility, not certainty.” Equipment shortages out of China and Southeast Asia, coupled with continuous port labour uncertainty, add further stress to the trade lane.
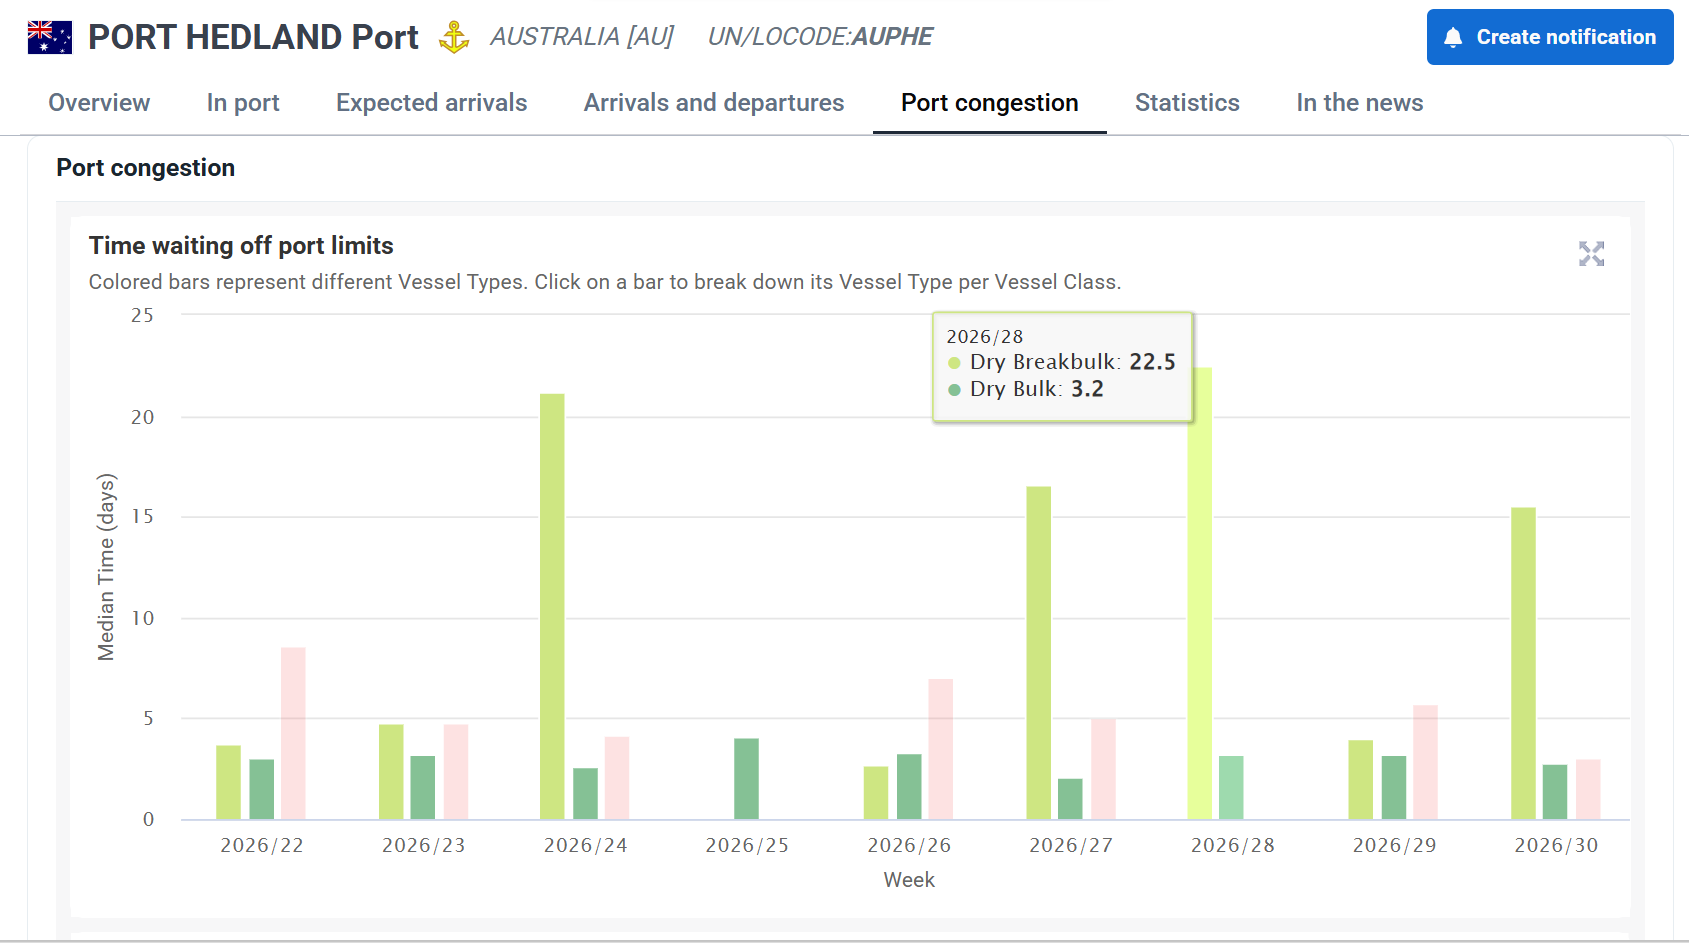
While front-loading has a direct impact on US imports, the industry’s interconnectedness means shipping is impacted globally. In Australia, Port Hedland saw increased congestion in June with official anchorage numbers showing vessels waiting up to 9.43 days at anchorage. And, according to Marine Traffic, dry breakbulk vessels have had to wait over 3 weeks for a berth—for a mid-sized charter vessel, 22.5 days detention could cost the charterer anywhere from USD 562,500 to USD 787,500!
There’s no denying that, over the last six years, the industry has faced one unprecedented event after the other: from the shutdown of Industry at the start of the global pandemic to its subsequent rebound, the Suez Canal blockage, the extended El Niño caused drought in the Panama region, the Red Sea conflict, Trump’s “Liberation Day” Tariffs, and, most recently, geopolitical stress in the Strait of Hormuz. The wars in the region have led to continued diversions, prolonged recovery timelines and heightened insurance premiums, all adding additional stress on an already congested gateway.
All of which has a flow-on effect, and has resulted in a surge in ocean rates, taking them to a 22-month high in July 2026. For example, the spot rate for a 40-foot container (FEU) from Shanghai to Los Angeles hit its highest point since 2024 (when ships were first diverted from the Red Sea). Leading up to this point, rates climbed steadily over a period of 10 weeks to nearly triple since the beginning of the war in Iran in February. Since February 28th, the FEU spot rate from the Far East to the US West Coast surged 231% and to the US East Coast surged 234%.
The higher demand caused by this period of front-loading means that successive general rate increases (GRIs) and peak season surcharges are being absorbed with minimal resistance. Shipping lines will set a base ocean freight rate, and GRIs will apply across an entire trade lane. There are several contributing factors to a GRI; they include (but are not limited to):
-
- Increased demand
- Port congestion
- Container shortage
- Blank sailings
- Reduced vessel capacity
- Rising fuel costs
- Labour disruptions
- Global economic conditions
- Rising shipping expenses (particularly energy prices)
- Changes in trade patterns
- Geopolitical events
- Canal restrictions
- Vessel diversions
- Added insurance premiums and surcharges (e.g. the emergency fuel surcharge carriers are implementing in August 2026).
Any one of these occurring is reason enough for prices to surge, let alone the current combination of ‘all of the above’. With the new tariffs in effect, we appear to have overcome the ‘hump’ of this shifted peak season. However, a temporary de-escalation can’t immediately restore normal operations, and prices are expected to fall a lot slower than they climbed.
According to the Drewry World Container Index, this recent surge in spot rates marked the third highest in recorded history (since 2011), beat out only by pandemic-level freight costs. However, the drivers behind these surges couldn’t be more different. One surge period was caused by consumer (organic) demand, and the other was policy-driven front-loading mania. While we’re observing undeniable port congestion, particularly along the US West Coast, the last 6-7 years navigating this evolving landscape have forced our industry to be resilient. Ports have become better equipped for the changing landscape with higher capacities, more efficient throughput, increased cargo flow visibility and carrier coordination. While this is the start we need, the congestion has just been pushed further down the supply chain, after the goods have left port gateways. These post-discharge delays result in higher storage and detention costs, with bottlenecks arising due to limited drayage and warehouse capacity, wash-pad availability, and increased inland transport (road and rail) demand.
We have continued to stray from industry norms and consistent peak season patterns to observe a new pattern emerging in US trade. A pattern where a tariff announcement triggers front-loading, concentrating import volumes and straining the supply chain. A reality quite different to the once consumer-driven peak in October. After recording a record-breaking June, the Port of Los Angeles Executive Director Gene Seroka shared his observations, stating that importers have increasingly abandoned traditional seasonal shipping patterns, moving cargo whenever trade conditions create an opportunity.
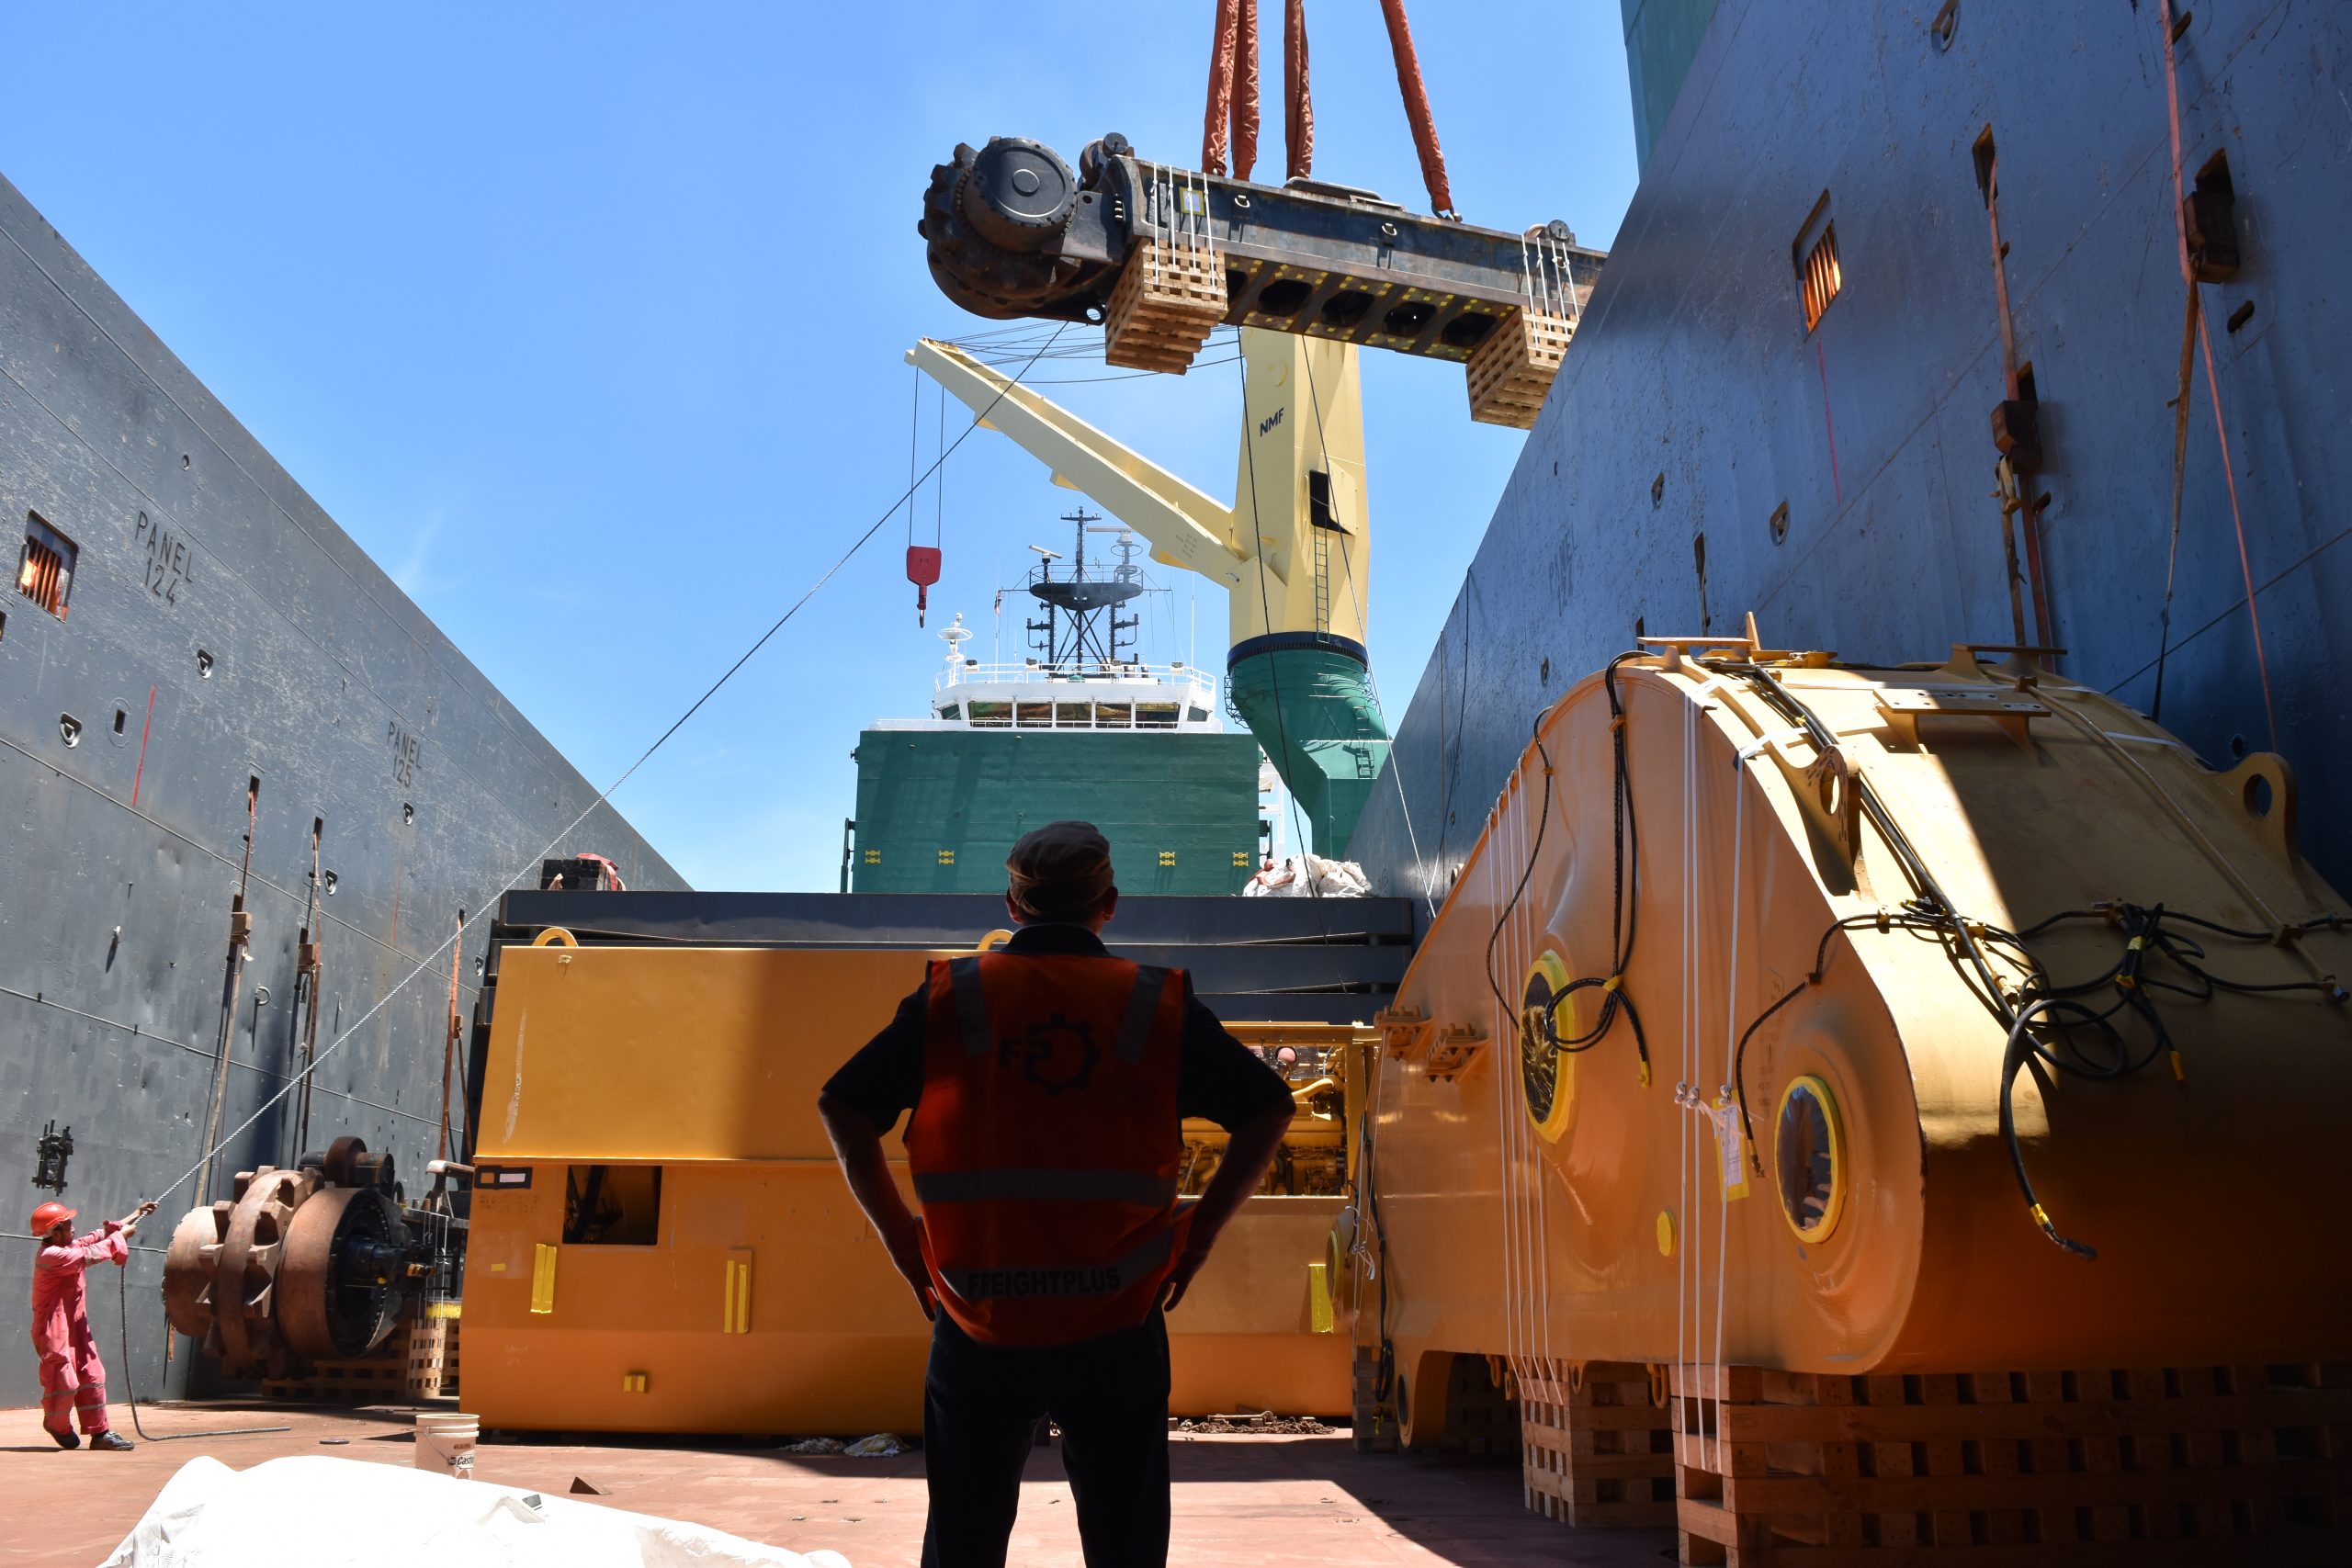
As a Freightplus customer, you can be assured of our support, navigating this evolving landscape. Adapting to this constant change and finding solutions to overcome the most complex logistical challenges in order to get your assets to wherever you need them is something the Freightplus team is getting really good at and thoroughly enjoy doing.
Need assistance finding the right solution for your heavy or project shipping needs? Drop us a line! www.freightplus.com/contact
Sources:
Advanced Logistics Solutions. (2026, July 20). U.S. ports set July 2026 record: what 2.47 million TEU means for supply chains. https://www.als-int.com/insights/posts/us-ports-record-imports-july-2026/
Allison Shipping. (n.d.). Understanding general rate increases in shipping. Retrieved July 30, 2026, from https://www.allisonshipping.com/insights/understanding-general-rate-increases-gris-in-shipping/
Chand, N. (2026, July 30). Ocean freight under pressure, heavily constrained trade corridors: Sascha Geiken. SeaNews. https://www.seanews.co.uk/maritime/ocean-freight-under-pressure-heavily-constrained-trade-corridors-sascha-geiken
Chirls, S. (2026, July 27). War sends Asia-US ocean rates soaring 234% since February. FreightWaves. https://www.freightwaves.com/news/war-sends-asia-us-ocean-rates-soaring-234-since-february?oly_enc_id=8686I5222056C8S
Chirls, S. (2026, July 9). 2M+ import containers to set new record, say retailers. FreightWaves. https://www.freightwaves.com/news/2m-import-containers-to-set-new-record-say-retailers
Drewry Shipping Consultants. (n.d.) World Container Index. https://www.drewry.co.uk/supply-chain-advisors/supply-chain-expertise/world-container-index-assessed-by-drewry
Duprey, R. (2026, July 18) Is another inflation wave coming? Container shipping rates have tripled since the Iran war began. 24/7 Wall St. https://247wallst.com/investing/2026/07/18/is-another-inflation-wave-coming-container-shipping-rates-have-tripled-since-the-iran-war-began/
Heavy Duty Trucking. (2026, July 10). July imports poised to set container record. https://www.truckinginfo.com/news/july-imports-poised-to-set-container-record
Lawyer, D. (2026, July 24). Trump to impose ‘forced labor’ duties on Friday as temporary 10% US tariffs expire. Reuters. https://www.reuters.com/world/us/trump-impose-forced-labor-duties-friday-temporary-10-us-tariffs-expire-2026-07-23/
Marine Traffic. Port Hedland congestion. Retrieved July 31, 2026 from www.marinetraffic.com
Minchin, J. (2026, July 27). Port Hedland congestion continues to hit multi-month highs. Lloyds List. https://www.lloydslist.com/LL1157992/Port-Hedland-congestion-continues-to-hit-multi-month-highs
Notice of Actions in Section 301 Investigations of Acts, Policies, and Practices of Various Economies Related to the Failure of Each Economy to Impose and Effectively Enforce a Prohibition on the Importation of Goods Produced with Forced Labor, 91 F.R. 47318-47662 (Proposed July 28, 2026).https://ustr.gov/sites/default/files/files/Press/Releases/2026/FLIP%20301%20Investigation%20Final%20Action%20FRN%207-23-26%20FINAL.pdf
Port of Long Beach. (2026, June 23). June 2026 Supply Chain Insight with CEO Dr. Noel Hacegaba. https://polb.com/port-info/news-and-press/port-of-long-beach-cargo-shows-double-digit-growth-06-23-2026/
Port of Los Angeles. (2026, July 15). Port of Los Angeles records best June ever, tops 1 million container units. https://portoflosangeles.org/references/2026-news-releases/news_071526_june_cargo
Schuler, M. (2026, July 24). Tariff-driven frontloading pays off as Trump reinstates global import duties. gCaptain. https://gcaptain.com/tariff-driven-frontloading-pays-off-as-trump-reinstates-global-import-duties/
Trading Economics. (n.d.). Containerised Freight Index. https://tradingeconomics.com/commodity/containerized-freight-index
United States Trade Representative. (2025, July 23). USTR Takes Action in Forced Labor Section 301 Investigations. Office of the United States Trade Representative. https://ustr.gov/about/policy-offices/press-office/press-releases/2026/july/ustr-takes-action-forced-labor-section-301-investigations
Freightplus. Worldwide.